Category: Statistics
Cauterizing Open Wounds
One of the most difficult parts of starting your own program or of consulting with a new organization is the need to evaluate and change existing practices. In almost all cases groups have been optimizing for a while, often times with one or more people owning the program and who have built their reputations off of prior practice. Any prior actions have been done with their name attached and they have enjoyed the perceptions of success. The problem is though that people rarely evaluate the reality of their statements and are often not aware or too busy to really know if what they are saying is real or pure BS (this explains the entire agency system).
This can be extremely problematic as it is vital to stop any bad practices before you can implement needed discipline and really make a positive impact for your company. It does you no good to look into things like fragility or efficiency, or in controlled experiments or segment discovery if you are operating in a world where people expect to test out 1 or 2 ideas based on opinions and to do this in 2-3 days. If your organization actually thinks that things like 48 hours to run 8 tests and clicks on a button are a measure of success then no amount of real optimization is going to matter until you make it clear just how off the entire process is. Of course if you do this poorly then you are just making yourself public enemy number 1 and since you are the new guy in the room you are basically setting yourself up for failure.
The key is to understand the issues and tackle all of them without prejudice and to evaluate the program for all of them. That way people see that you are not attacking someone or something but simply evaluating the program for inefficiencies. If everything is up for grabs and somethings pass and something go then at the least you are removing the direct confrontational element from it. If you can further push the conversation into one of what defines success and simply focus on those components then many of the would be battles simple fall by the wayside.
Generally the things that need to evaluated and often changed fall into a number of common categories. These include:
Acting on test:
-
False belief in confidence
Acting too quickly
No consistent rules of action
Lack of Process:
-
No consistent way of getting results live
No single person owning test ideation, just random ideas thrown up
Lack of data control:
-
Wrong metrics
No variance study
Lack of proper segment analysis
The main problem with any or all of these is that there will be a library of tests that people have believed and most likely built entire strategies around. It doesn’t matter if it is what pages do or do not work, the impact of certain changes or where and who to test to, this misinformation is far more damaging then any positive result that you could generate.
All results are contextual, and as such this means that you must set the proper context in order to really evaluate the impact of a test or process. If you have people believing a 200% increase because they were looking at one group and on clicks on a button then it can be nearly impossible to talk about a 5% RPV increase because it just sounds too small and not as important to them, despite the fact that the 200% click increase could have actually caused a 10% loss in revenue. If you or others do not understand the core principles and math involved then they are more likely to fall for any BS that they come across. You must focus on education and on the disciplines, not just stories if you want to make meaningful long term impact.
This is why stopping the bleeding is such an important and difficult task to overcome. People don’t realize how far off they really are and often times have never been called out for their BS, resulting in entire careers built on bad outcomes and false conclusions. In my case I am looking at everything from acting too quickly (18 conversions versus 32 conversions is meaningless), a lack of variance understanding, and a lack of discipline on test ideas. These things were not done because someone was malicious or self serving. they were not done because of a lack of intelligence or a lack of want to improve the business, they were simply done because the person did not know better and because there is just so much bad information out there.
The real challenge here is controlling expectations and helping people understand the error in their ways. I am extremely lucky to work with a number of very smart people who are willing to listen to and understand issues which they never knew they were dealing with, like the variance problems I previously discussed. The challenge if far more in people understand that just because they come from a place that is used to testing in 1-2 days or in tracking a certain thing it just means that they were really good at wasting their companies time and resources. It is also important to also set proper expectations on what the movement speed will be. If they are thinking you can get a result in 2-3 days and it is going to take 2-3 weeks, this can completely shift your view of optimization to a the negative despite the fact that you are really moving from something that was damaging the company to something that is going to cause consistent positive growth.
More then anything it is important to realize that you have to stop all bleeding and make that the primary focus before you can overly concern yourself with making big changes. This doesn’t mean that you don’t do any tests or the like, in fact it is important for people to see what they should be doing so that they can really appreciate how far off they were prior. If someone doesn’t know what success looks like then any point on the map can be success for them. It simply means that controlling the message and focusing on education is vital at the start of any program.
Google Experiments, Variance, and Why Confidence can really suck
There are many unique parts to optimizing on a lower traffic site, but by far the most annoying is an expected high level of variance. As part of my new foray into the world of lead generation I am conducting a variance study on one of our most popular landing pages.
For those that are not clear what a variance study is, it is when you do multiple variations of the same control and you measure all of the interactions against each other. In this case I have 5 versions of control which gives you a total of 20 data points (all 5 compared to the other 4). The point of these studies is to evaluate what the normal expected variance range is as well as the minimum and maximum outcomes from the range. It is also designed to measure this over time so that you can see when and where it normalizes down to as each site and page will have a normalization curve and a normal level of variance. For a large retail site with thousands of conversions a day you can expect around 2% variance after 7-10 days. For a lead generation site with a limited product catalog and much lower numbers, you can expect higher. You will always have more variance in a visit based metric system then a visitor based metric system as you are adding the complexity of multiple interactions being treated distinctly instead of in aggregate.
There are many important outcomes to these studies. It helps you design your rules of action including needed differentiation and needed amounts of data. It helps you understand what the best measure of confidence is for your site and how actionable it is. It also helps you understand normalization curves, especially in visitor based metric systems as you can start to understand if your performance is going to normalize in 3 days or 7. Assume you will need a minimum of 6-7 days past that period for the average test to end.
The most annoying thing is understanding all the complexities of confidence and how variance can really mess it up. There are many different ways to measure confidence, from frequentest to Bayesian and P-Score to Chi Square. The most common ways are Z-test or T-Test calculations. While there are many different calculations they all generally are supposed to tell you very similar things. The most important of which is what is the likelihood that the change you are making is causing the lift you see. Higher confidence means that you are more likely to get the desired result. This means that in a perfect world a variance study should have 0% confidence and you are hoping for very low marks. The real world is rarely so kind though and knowing just how far off from that ideal is extremely important to knowing how and when to act on data.
This is what I get from my 5 experience variance study:
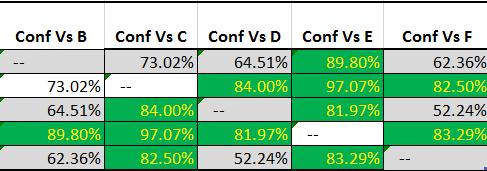
To clarify, this is using a normal Z-Test P-Score approach and there are over the bare minimum conversions that most people recommend (100 per experience). This is being done through Google Experiments. The highest variance I have ever dealt with on a consistent basis is 5% and anything over 3% is pretty rare. Getting an average variance of 11.83% after 5 days is just insane:
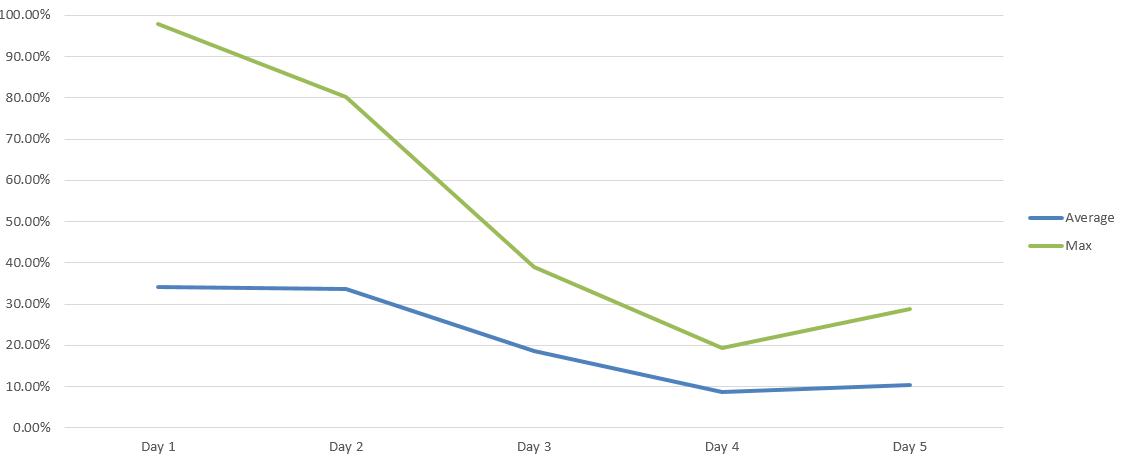
This is just not acceptable. I should not be able to get 97% confidence from forced noise. It makes any normal form of confidence almost completely meaningless. To make it worse, if I did not do this type of study or if I did not understand variance and confidence then I can easily make a false positive claim from a change. These types of errors (both type 1 and type 2) are especially dangerous because it allows people to claim an impact when there is not one and allow people to justify their opinions through purely random noise.
If you do not know your variance or do have never done a variance study, I strongly recommend that you do so. They are vital to really making functional changes to your site and will allow you to avoid wasting so much resources and times on false leads.
How You can Stop Statistics from Taking Advantage of You – Part 1
You can’t go five minutes in the current business world without the terms big data, predictive or statistical tool being thrown about. If one was to believe all of the hype you would have no problems making perfect decisions, acting quickly, and all everyone would be improving their performance by millions of dollars every hour. Of course everyone in the field also acknowledges just how far everyone else is from that reality, but they fail to mention the same errors in logic from their own promises and their own analysis. All data is leveraged using mathematical tools many of which do not have the level of understand that are necessary to maximize their value. Data can both be a powerful and important aid to improving business and a real deciding factor between success and failure. It can also be a crutch used to make poor decisions or to validate one opinion versus another. The fundamental truth is that nothing with “big data” is really all that new, and that in almost all cases, the promises that you people are making have no basis in reality. It is vital that people understand core principles of statistics that will enable them to differentiate when data is being used in either of those two roles and to help maximize the value that data can bring to your organization.
So how then do you arm yourself to maximize outcomes and to combat poor data discipline? The key is in understanding key concepts of statistics, so that you can find when and how promises are made that cannot possibly be true. You do not need to understand the equations, or even have masterly level depth on most of these topics, but it is vital that you understand the truth behind certain types of statistical claims. I want to break down the top few that you will hear, and how they are misused to make promises, and how do you really achieve that level of success.
Correlation does not Equal Causation –
Problem– I don’t think anyone can get through college without having heard this phrase, and most can quote it immediately, but very few really focus on what it means. The key thing to take from this is that no matter how great your correlative analysis is it can not tell you cause of the outcome nor the value of items without direct active interaction with the data. No matter how much you can prove a linear correlation or even find a micro-conversion that you believe is success, by itself it can never answer even the most basic of real world business questions. They can be guiding lights towards a new revelation, but they can also just be empty noise leading you away from vital information. It is impossible to tell if you leave the analysis at just basic correlation, yet in almost all cases this is where people are more then happy to leave their analysis. The key is to make sure that you do not jump to conclusions and that you incorporate other pieces of information instead of blindly following the data.
Just because I can prove a perfect correlation between email sign-ups and conversion rate, that they both go up, I can never know from correlation alone if getting more people to sign-up for emails CAUSED more conversions, or if the people we got to convert more are also more interested in signing up for email. In a test this is vital because not only is it easy see those two points, but you are also limited with only a single data point making even correlation impossible to diagnose. It is incredibly common for people to claim they know the direction and that they need to generate more email signups in order to produce more revenue, but it is impossible to make that conclusion based on purely correlative information alone and it can be massively damaging to a business to point resources in a direction that can equally produce negative and not positive results.
The fundamental key is to make sure that you are incorporating consistent ACTIVE interaction with data, where you induce change across a wide variety of items and measure the casual value of them. Combined or leading your correlative information you can discover amazing new lessons that you would never have learned before. Without doing this the data that many claim is leading them to conclusions is often incomplete for fundamentally wrong and can in no way produce the insights that people are claiming. The core goal is always to minimize the cost of this active interaction with data while maximizing the number and level of alternatives that you are comparing. Failure to do this will inevitably lead to lost revenue and often false directions for entire product road maps as people leverage data to confirm their opinions and not to truly use data rationally to produce amazing results.
Examples – Multiple success metrics, Attribution, Tracking Clicks, Personas, Clustering
Solution – Causal changes can arm you with the added information needed to answer these questions more directly, but in reality that is not always going to be an option. If nothing else, always remember that for any data to tell you what lead to something else, you have to prove three things:
1) That what you saw was not just a random outcome
2) That the two items are correlated with each other, and not just some other change
3) That you need to prove causal direction to be able to prove any conclusion
Just the very act of stopping people from not racing ahead or abusing this data to prove their own agenda will dramatically improve the efficiency of your data usage as well as the value derived from your entire data organization.
Rate vs. Value –
Problem – There is nothing more common than finding patterns and anomalies in your analytics. This probably is the single core skill of all analysis, yet it can often be the most misused or abuse actions taken with data. It can be segments that have different purchase behavior, channels that behave differently, or even “problems” with certain pages or processes. Finding a pattern or anomaly at best is simply the halfway point of actionable insight, not the final stop to be followed blindly. Rate is the pattern of behavior, usually expressed as a ratio of actions. Finding rates of action is the single most common and core action in the world of analytics, but the issue usually comes when we confuse the pattern we observe with the action to “correct” that action. Like Correlation vs. Causation above though, a pattern by itself is just noise. It takes active interaction and comparison with other less identified able options in order to validate the value of those types of analysis.
Just because Google users spend 4.34 min per visit or email users average visit depth is 3.4 pages are examples of rates of action. What this is not is the measure of value of those actions. Value is the change in outcome created by that certain action not the rate at which people happen to do things in the past. Most people understand “past performance does not ensure future outcomes” but they fail to apply the same logic when it comes to looking for patterns in their own data. Value is expressed as a lift or differentiation, things like adding a button increased conversion by 14% or removing our hero image generated 18% more revenue per visitor.
The main issues come from confusing the ability to measure different actions with knowing how to change someone’s behavior. The simplest example of this is the simple null hypothesis of what would happen if that item wasn’t there? Just because 34% of people click on your hero image which is by far the highest amount on your homepage, what would happen if that image wasn’t there? You wouldn’t just lose 34% of people, they would instead interact with other part of the page. Would you make more less revenue? Would it be better or worse?
It also comes down to two different business questions. At face value the only possible question you could answer with just pattern analysis is, “What is an action we can take?”, in the ideal value business case you would instead answer “Based on my current finite resources, what is the action I can take to generate the most X” where X is your single success metric. Rates of value have no measure of ability to change or of cost to do so, and as such they can not answer many of the business questions that they are erroneously applied to.
Examples – Personalization, Funnel Analysis, Attribution, Page Analysis, Pathing, Channel Analysis
Solution – The real key is to make sure that built into any plans of optimization you are incorporating active data acquisition and a that you are always measuring null assumptions and measuring the value of items. This information combined with knowledge of influence and cost to change can be vital, but without it is likely empty noise. There are entire studies in math dedicated to this, with the most common being bandit based problem solving. Once you have actively acquired knowledge, you then will start to build information that can start to inform and improve the cost of data acquisition, but never replace it.
These are but two of the many areas where people consistently make mistakes when leveraging data and concepts from statistics to make false conclusions. Data should be your greatest asset not your greatest liability, but until you help your organization make data driven decisions and not data validated decision there are always going to be massive opportunities for improvement. Make it a focus to improve your organizations understanding and interaction with each of these concepts and you will start using far less resources and making far better outcomes. Failure to do so also insures the opposite outcomes over time.
Understand data and data discipline have to become your biggest areas of focus and educating others your primary directive if you truly want to see your organization take the next step. Don’t let just reporting data or making claims of analysis be enough for you and you will quickly find that it is not enough for others.
Everyone Loves a Model
As the online world starts to get deeper and deeper into mathematical disciplines, new people are constantly being made aware of all the amazing mathematical tools that are available. Often times marketers are talking about or leveraging these tools without really understanding the math part, as they get caught up in the more common names, things like media mix modeling, confidence, or revenue attribution modeling. The problem arises however when those tools and their power are focused on, but not the disciplines and functions that make them viable as tools. Just having access to some way of looking at data does not inherently make it valuable, yet too many analysts end the conversation at that point. Every tool is only as good as the way you use it. So how then do you enable people to get value from these tools instead of just empty promises left from not understanding the real nature of the tool.
Before anyone starts focusing on mathematical models, the first thing and the last thing that must be understood is by far my favorite quote about math, “All models are wrong. Some are useful.” All models are built off of assumptions, and those assumptions determine the validity of any output of that system. Not only do the assumptions have to be understood at the start, but as the enviroment that you are modeling evolves, they too must be kept true, which can be extremely problematic with the constantly changing nature of the digital world. Because of this, a constant and vigilant awareness of not only the initial assumptions, but also the longer term continued fit of those assumptions is vital for getting a positive outcome in the long term.
In the world of testing, the most common models used are p-score based models. T-Test, Z-Score, Chi-squared models are all basically different versions of the same concept. The most important things that people miss are that these models require a number of key things before they can ever be useful. The first two things that are monumental are that they require representative data to be meaningful. It doesn’t matter if all other parts of the model are correct if it has no reflection on the real basis of your business. Getting confidence quickly means nothing if the confidence does not reflect your larger business nature. This is why you will find people who do not understand this problem shocked when they act too quickly and then find that the real impact is different then what they measured.
The other large assumption is that the data distribution will approach a normal or Gaussian distribution (a bell curve). Data may over a long enough period approach that distribution, but the reality is that the biases, variance, and constraints of the everyday world mean that this distribution is questionable at best. Because both of the nature of online data collection, be it biased visitor entry, limited catalogs, or constrained numeric outcomes, all of these assumptions may never really come into effect. This does not mean that this, or any model, is completely worthless, but it does mean that you cannot blindly follow these tools even as a deciding factor between hypothesis.
But models are not restricted only to the testing world, in the analytics community, everything from attribution models to media mix modeling systems are becoming all the rage. The sophistication of these models range from one time basic models to large scale complex machine learning systems, but all of them have limitations that require you to keep a close eye on the context of their use. Even in the most advanced and relevant uses, it is important to note that the assumptions and model that you used need to be updated and changed over time. The nature of online data collection makes it so that there are so many variables that impact the bias and distribution of your users, that any model as a one-time fix will almost immediately lose value. Predictive model’s can have amazing impact on your business, but they can also lead you astray if you do not keep a watchful vigilance on the relevance on those models as the world they represents changes. The only true way to ensure value over any period of time is to update and incorporate learned behavior into your models and their usage.
The other limitation to keep in mind is that you start one model with only correlative information, often coming from one or more analytics solution. This gives you a great start, but like all other uses of this information, it lacks vital information that affects its value. The most important part of any use of a model such as these is to understand that you must constantly update that model, especially as you start collecting causal impact data that tells you your ability to influence behavior. A one-time model may sound great, and may give you a short term boost, but in the long term, it becomes almost meaningless unless you keep the model relevant and the data focused on the efficiency of outcome. The world is not static, nor should your use of approximations for that world be static.
This means that as you start to leverage any model, that you must make sure that you have members of your team that understand the nature of data and how best to leverage them. You may not need a full time statistician, but it does mean that you should be spending resources and improving the skills of your current resources to understand both the nature of the tools and the relevance to your business. A full time statistician may actually be a detriment to your group, as you need to make sure that you are not solely focused on classroom statistics, but instead on the real and often complex world of your particular environment. Everything you do should be focused on the pragmatic maximization of value to your organization.
I cannot suggest enough that you think about and explore ways to leverage models into your practices, and that you start to leverage their power to stop opinion based decision making. That being said, if you are to get value from these tools, you must understand both sides of the coin, and make sure that you keep you use of the models as relevant and powerful as their original intent. Never stop growing your understanding of your site, users, and the efficiency of change, but also keep that focus not only on your organization, but also on each tool you leverage to achieve your goals.
