How Analysis Goes Wrong: The Week in Awful Analysis – Week #3

How Analysis goes wrong is a new weekly series focused on evaluating common forms of business analysis. All evaluation of the analysis is done with one goal in mind: Does the analysis present a solid case why spending resources in the manner recommended will generate additional revenue than any other action the company could take with the same resources. The goal here is not to knock down analytics, it is help highlight those that are unknowingly damaging the credibility of the rational use of data. What you don’t do is often more important then what you do choose to do. All names and figures have been altered where appropriate to mask the “guilt”.

On this version of This Week in Awful Analysis, I wanted to start diving into the many false conclusions that people draw from the results of tests. There are problems from things like confidence, correlation, bias, and all sorts of drivers, but the most fundamental one is a failure to properly frame the result itself.

I want to walk you through a standard test experience. In this case, we are running a simple inclusions/exclusion test, where we see what the impact is of removing a certain item from the page. In this scenario, we ran our test, have gotten 1 week of consistent data (about 16 days total), have enough differentiation and enough data, so we are ready to call our test:

In this scenario we see we have a winner, and so we report this winner to our org, suggest we remove the section, and move on…

Except that is the only part of the story we allowed ourselves to look at, due to a failure to think about and set-up the test in a way to show us what the best option is, not just a better one. In this scenario, let’s look at the exact same data, but in the larger context of the test that was really run:

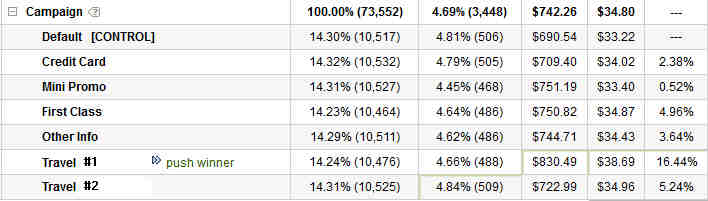
In this case, we still have the same 2.38% lift, but we can see that in a larger context, that is only the 3rd best option out of the 7 different ones we are looking at. Had we failed to set-up the campaign to look for the larger context, the new would have thought we were accomplishing something, while in reality we would have been throwing away 14% lift (16.44% – 2.38%). Would your pat yourself on the back if you were reporting a 14% net loss to the business? Do we reward you for the 2% gain or the 14% loss? This is a real world situation, but this plays out all the time when you fail to look past opinions and you only test what someone is asking for or wants to see win. We fail to get perspective, so we are leaving winners our there left and right, winners that would dramatically impact the entire business. Why then is it ok to validate some basic “hypothesis” without diving into the larger context and looking for the best answer?

Not only are you actually losing money left and right when you do this, but you are also driving your optimization in the future to suboptimal paths. This is how you get into local maximums and how programs can get stale. This is also why test ideas are the least important part of a test program, since they only constrain people’s imagination and their ability to look at feasible alternatives. Testing and optimization should free people up to go far past their comfort zones, as the system only really works when you get great divergent inputs. The more divergent, the better the inputs, the more likely it is that you will get a far better outcome for your business.

Overtime, this can have massive impact to the bottom line of any business. Here is a breakdown of a random number generator using normal distribution and the power of options (you only choose the best performer) looking at the impact of having 2, 3, 4, and 5 recipes in all your tests:

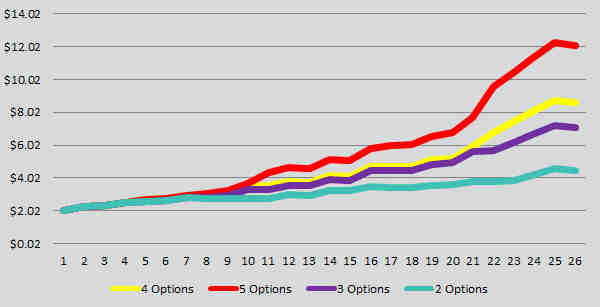
There is little to gain from running more tests, it is far important to run better tests and to look at alternatives, not to sit in a validation world of making people happy. If you fail to tackle the test with discipline and by challenging people’s opinions, you are dramatically limiting any possible impact you get.

If nothing else, never take just the act of getting a winner as a measure of a successful test. That is a sign that you are not trying to improve the business, just make yourself look good. Instead look at optimization as the ability to measure feasible alternatives, to have an active data acquisition which allows you to measure paths and to go down the best path. Do that, and you will add magnitudes greater value to all the actions you take.

The Road to Greatness: The Do’s and Don’ts of Expanding Optimization Throughout your Organization

One of the great frustrations of an optimization group can be working with other groups to build out and optimize their current initiatives. While the natural outcome of this frustration is shy away and just to hand all control of testing to each group, result show that this is consistently the worst way to get value from your optimization efforts. To add to this some groups think the only way they can expand is to add resources, instead of improving how and when you do certain actions. In a lot of cases, the most important battles that you end up waging having nothing to do with getting a test live or with sharing results, but instead in helping grow a new discipline throughout an organization. So how then do you work within your organization to build out the correct disciplines while making sure that you are able to test as often and as much as possible?

While there is no single answer to solving this ageless riddle, there are a number of common factors that differentiate the groups that do get real value, from the ones that have to come up with stories to justify their existence. These can often be the hardest, slowest, and most political actions you take for your program, but in the end they are almost always the efforts that produce the greatest returns. The practice of optimization is about change, not just in elements in a user experience, but also in the quest to improve how the organization itself thinks about and tackles problems. How these specific disciplines play out will always take a unique aspect to match your current organization, but the core disciplines will always remain.

DO – Make education a primary goal of your entire program

From the start, be it single success metric or just why and how you test, you have to take control and help others understand how and why you are going to tackle problems. Stopping people from measuring the wrong things can be more important then what you do measure, but also requires you to stand up and have the conversation that the person asking doesn’t want to have prior to starting the test.

Testing seems easy, but the reality is when you are doing it right it can cause a lot of confusion and discomfort for a lot of different members of each team. You are directly measuring that outcome of things and adding accountability to opinions that makes almost everyone uncomfortable. You need to be cognizant of their worries and current focus while helping them understand why you need to do things. It is vital these conversations happen before you take any action, otherwise you will inevitably either sub optimize or even worse, get into a political battle between groups.

DON’T – Try to tackle the entire organization at one time

There is a famous saying, “How do you eat an elephant? One bite at a time”. The same holds true for growing your practice within the organization. Don’t try to convince everyone to do the right thing, instead focus on specific people or groups, and start with less high profile ones. No one is going to just change for the sake of change, especially since almost all change you are looking to create is against their own personal empire and agenda. Once you show success with those smaller groups, and you show how discipline played a big role in the outcomes, this will help you convince or deal with other groups and eventually you will find that the entire elephant has been eaten.

DO – Make sure that all testing conversations focus on a series, not on the execution of an idea

People always start testing thinking of ways to validate their single idea. They think X is better than Y, and want to use testing to prove it. This is without fail a massively flawed and inefficient manner to test, yet it is where a lot of groups stay due to the ease of just doing what others want. The key to any test is to make the learning, growth, and iterative improvement part of every conversation, starting at day one. Never let conversations just stand that are about which is better, but instead change them to the discovery of what is valuable and how do you exploit that information. It may cause a bit of discomfort at the start, but the reality is that if you do not make this a priority, you will inevitably start getting into the rut of single concept tests.

DON’T – Report everything that everyone wants

This is especially uncomfortable for analytics groups that try to add testing on as just a function. Part of optimization is the discipline to focus on what does matter, and to not pretend that you can answer the whole slew of questions that come. People bought more, but what did they click on? Where did they go? Why did they do what they did? The reality is that you have no clue even the correlation from a single data point, so that data is irrelevant. People spent more, but what product? Again, this will only cause conflict between specific product teams and do nothing to focus on the change that needs to happen.

The key is to focus on education and your single success metric to understand why you don’t do these things. It is ok to look at other metrics, so long as you do not draw ANY conclusions from them in a single test, and you look at ones that have a chance to provide value (this means not clicks). You will be able to spot patterns only after you collect a large number of data points and are disciplined in how you look at the larger picture of your optimization efforts.

DO – Make the analysis of optimization patterns far more important than a single test

Over time you will start to build out knowledge across tests. While it is easy to focus on only what you are dealing with in any given day, the reality is that the real lessons that you can learn don’t come from a single data point, but across large numbers of tests. These lessons, be it what types of changes or where you should focus, become the most valuable piece as they shape your entire future product road map. This means that you need to make this information available, but also champion these larger lessons and help others understand that specific tests probably won’t reveal as great of lessons.

DON’T – Just run an idea someone brings to you

Deconstruction, the ability to look at the assumptions that made someone come to a conclusion, becomes a vital skill in the hands of a great optimizer. Every time you tackle an assumption, you enable a greater possible outcome and also allow each test to possibly impact far more then intended. Want to test content to a specific user group on your front door? Does content matter most? How about which group? How about where in the user flow? You can easily start building tests to have enough variations and to tackle these larger questions, but only if you make it a priority. One of the great complaints of optimization is the concept of local maximum, but the reality is that this mostly comes from the limits of the imagination of the testers, and not from the specifics of the test itself.

I am sure that most people at multiple points here asked how realistic these suggestions are? There are hundreds of excuses why people do things, but the reality is that it is up to you to stand up and do the right thing, even if uncomfortable, at all times, otherwise you will find it nearly impossible to do the right thing when it is required. If you are proactive in your education, and make these a focus, you will find it is far easier to push back when and as needed.

There are hundreds of other possible things you can do to expand the optimization practices throughout your organization. If you simply nail these few items, you will avoid almost all of the major pitfalls that lead to programs becoming stagnant or pretending they are generating far more value than they really are. No step you take will be easy, but if you are consistent, up front, and make these actions a priority over the specific actions of running a test, you will be amazed at how far the entire practice has gone in just a few months.

How Analysis Goes Wrong: The Week in Awful Analysis – Week #2

How Analysis goes wrong is a new weekly series focused on evaluating common forms of business analysis. All evaluation of the analysis is done with one goal in mind: Does the analysis present a solid case why spending resources in the manner recommended will generate additional revenue than any other action the company could take with the same resources. The goal here is not to knock down analytics, it is help highlight those that are unknowingly damaging the credibility of the rational use of data. All names and figures have been altered where appropriate to mask the “guilt”.

What you don’t do is often more important then what you do choose to do.

This week for How Analysis Goes Wrong, I wanted to start covering a number of the many errors in rate versus value and how it can be used to pretend to know things that you really don’t. I figured I would start with the most obvious example there is, which would be “how much revenue comes from email”. So many times in the realm of optimization you are faced with having to stop people from applying resources towards actions that could never produce meaningful results. The most obvious of these is email.

Analysis: We want to optimize our email because 60% of our revenue comes from email.

There are a number of problems with this, but let’s tackle the analytics ones first, and then move on to the optimization ones.

1) You have no clue if 60% of you revenue COMES from email, you only can attribute 60% of revenue to email. The difference is this. In attribution, you can’t say what direction something happens, only that a group of people have a common trait (usually channel). You cannot in any say if email drives 60% of your sales, or if in the real world situation, the people who want to spend a lot of money on your site on a regular basis might be inclined to sign up for email.

2) It suffers from the graveyard of knowledge effect of not saying what the difference in performance of people with and without email are, especially since it is only looking at success of revenue and not all users.

3) It assumes that just because 60% of revenue comes from a group that optimizing that group is more valuable than any other group. Unless you know your ability to change their behavior and the cost to do so, you cannot ever make that gross assumption.

4) Statements like these are used for internal competitive evaluations of groups (paid, email, display, etc…). People are going to abuse data, that is a given, but the fact that someone who is responsible for optimization or analytics, the one person in the company who should be most concerned with the correct portrayal of data in a rational sense, is the one most likely to make a statement like this. Keep your data people away from politics!

I can go on, but I want to dive a little deeper into the evils of email testing. It is not that email testing cannot produce results; it is simply that the scale of those results and the cost to do so is so insanely high that there is no point in ever going down that path.

Here is some example math. If you are interested, this assumes a 20% higher action rate and RPV compared to an actual extremely larger retailers actual performance. It assumes a 10% margin on actions. Both of those are actually higher than the customer in question, but I wanted to over promise value to show how obscured optimizing email can be:

Open rates and all other metrics come from this article, but there are many other similar sources out there.

I usually share a story with people when we get to this point, which goes like this. I worked with a very large ticket reseller who had spent 2.5 years optimizing their email, and had been able to achieve a 120% increase through having 2 full time resources spend that time on nothing but optimizing their email. The total value in increased revenue they derived was around 600k, which sounded great.

My first week working with the customer, we went to the least political page, used existing internal resourced, did a simple real estate test, and that test was worth approximately 6 million.

Total time spent on conversation and setting that test up, 1 hour.

Future testing continued to show similar scale of results without even touching their most political pages. In 1 hour, we were able to show that they wasted 2.5 years and all those resources chasing a mythical dragon. The real punch line of this story is the reason they did all that work is because they “knew” that 72% of their revenue came from email.

Do not let this happen to you.

How Analysis Goes Wrong: The Week in Awful Analysis – Week #1

How Analysis goes wrong is a new weekly series focused on evaluating common forms of business analysis. All evaluation of the analysis is done with one goal in mind: Does the analysis present a solid case why spending resources in the manner recommended will generate additional revenue than any other action the company could take with the same resources. The goal here is not to knock down analytics, it is help highlight those that are unknowingly damaging the credibility of the rational use of data. All names and figures have been altered where appropriate to mask the “guilt”.

I thought it was time that I start breaking down some of the awful analysis that I hear on a daily and weekly basis. In all cases, I am choosing analysis that is presented with a straight face and that is believed to be amazing or justified by the person doing the analysis. There are many reasons for someone to present an analysis, justifying their job, giving a boss what he wants, making someone happy, boredom, ignorance. I can not speak for why someone thought this was a good idea, I can only evaluate their ability to make a meaningful business case.

This evaluation will not focus on those as the end objective, but will instead focus on measuring each form of analysis on the single objective measure of, “Does the analysis present a logical case for the use of resources in such a way that those resources will be used to generate additional revenue as opposed to any other use of those same resources.” This does not in any way say that the conclusion reached is wrong, simply that the data presented in no way confirms this conclusion.

To start, I wanted to walk through one of the most common types of analysis I hear from web analysts. There will obviously be more to the larger conversation then shared with the analysis presented, but in all cases I am tackling the common traits of the larger conversation, what is and is not presented. This exact case was shared with me as an example of the amazing power of analytics earlier this week (though numbers have been changed to protect the individual and organization involved):

Analysis: Checking your fallout report, we see that your registration page has an exit rate of 74%. The industry standard for those pages is 50%. This means that we should attempt to improve that page and if it were to meet industry standard, the change would be worth 3.4 million dollars per year.

Problems: There are a large number of assumptions that go into this type of analysis, so I want to hit them on a high level one by one:

1) There is a linear rate of outcome for people in the flow. I have 50 people that produce 200, so if I add an additional 50, then I will get 400. This ignores that you have no idea the behavior pattern of the people who weren’t spending money before, that you are magically getting to do so now. They are not like your other users, but you assume they will suddenly behave the exact same way.

2) You ignore the single most fundamental rule of optimization, you need three pieces of information to know the value of a change. You need to know population, ability to influence, and cost. It does no good to talk about a real world problem if it would take 10 times the amount of resources to achieve a goal.

3) It ignores the reality of finite resources, so that for that same cost to get that lift to that population what else could you do to with those resources and how have you given any measure that this is more valuable than any other action?

4) It assumes the issue is on that page, and not the prior one, or before, or the traffic itself that comes to the site.

5) It assumes that the changes you make to improve performance will not negatively impact (it actually assumes no impact) to the existing purchasers on the site.

6) It ignores the fact do you even have access to the page, resources to change it, and a political environment that will allow those changes? If the suggestion can’t be acted on, you just wasted everyone’s time.

7) It ignores the time it would take to get that change. You can magically give a revenue number and say for a year, and not know if it will take you 9 months or 2 weeks to hit that magical mark.

8) It gives an absolute revenue figure. You cannot give a perfect projected revenue figure, no matter how much you believe in your predicative measures. There is always a variance and error rate, and you have to assume that nothing in the world related to the site will change during that magical period of time.

I can keep going, but will hit many other points during future breakdowns. Fundamentally, this analysis fails because it assumes that an anomaly or pattern in correlative data tells you anything about the ability to change things based on the finite amount of resources that any group finds itself needing to leverage. Because of this, it focuses on some magically high dollar figure, but does not account for cost, alternatives, time, or where the “problem” actually is.

If there is an analysis that you would like to have reviewed, privately or publicly, you can send an email direct at antfoodz@gmail.com